Agent Based Model Practical 5
1. Introduction and Preparation
In this part the ABM environment entity will be initialise from a file. The agents will interact with this environment in a simplistic way, and an output file will be generated.
In your local code repository src directory create a new directory called 'abm5'. Open Spyder and save 'model.py' and 'agentframework.py' into the 'abm5' directory. Create a new directory at the same level as your 'src' directory called 'data' and within this create new directories called 'input' and 'output'. These directories will be used to store the model data. It is good practice to store program data and program source code in different directories.
2. Input Data
Download/save into your newly created input data directory the text file: in.txt
Open the file in a text editor. Note that the file comprises lines of integer numbers delimited by commas. It is a CSV format file. It is rectangular, indeed square and has 300 lines each with 300 values.
Create a new source code file named 'io.py' in the 'abm5' directory, add the following lines:
import csv

# Read input data
f = open('../../data/input/in.txt', newline='')
data = []
for line in csv.reader(f, quoting=csv.QUOTE_NONNUMERIC):
    row = []
    for value in line:
        row.append(value)
        #print(value)
    data.append(row)
f.close()
print(data)
Run this new file. The output should correspond to the input data file only the values are presented with '.0' appended (as they have been loaded as Float and not Integer numbers).
Note that the data variable is a list of lists. Essentially the list is the rows of data and the lists contain the values in the columns for each row.
Change the code block into a function called 'read_data' that returns the data variable. Write code to call this function from 'model.py' by adding the following import statement:
import ioAfter the import statements try to call the 'read_data' function using:
environment = io.read_data()You should encounter an AttributeError along the lines of the following:
Traceback (most recent call last): File "\src\abm5\model.py", line 19, inenvironment = io.read_data('../../data/input/in.txt') AttributeError: module 'io' has no attribute 'read_data'
This is somewhat confusing as the new 'io' module has a function called 'read_data'! The exception is raised because there is a name collision. There is an 'io' standard library module which does not have an attribute named 'read_data'. It is the standard library module called 'io' that is being imported!
Either the non-standard library 'io' module needs to be renamed, or it needs to be packaged - which involves creating a directory and moving 'io.py' into it. Packaging is the recommended way forward. In the 'abm5' directory, create a directory called 'my_modules' and move both 'io.py' and 'agentframework.py' into it. Change the respective import statements in 'model.py' to be:
import my_modules.agentframework as af
import my_modules.io as io
Run 'model.py' and it should now run without the error. (If you still get an error then restart Spyder.)
Change the 'read_data' function so it checks that each row of 'data' contains the same number of values. Also change the function so it returns the number of lines (n_rows) and the number of values in each line (n_cols) as well as 'data'. (Hint, pack these in a tuple, and unpack the returned tuple in the code that calls the function initialising variables 'n_rows' and 'n_cols' as well as 'environment'.)
3. Plot environment
Assume that each row of 'environment' aligns with a y-coordinate and each column of 'environment' aligns with an x-coordinate.
To plot 'agents' on the 'environment' add the following at the start of the plotting section:
plt.imshow(environment)Change the initialisation of 'x_max' and 'y_max' to be as follows:
# The maximum an agents x coordinate is allowed to be.
x_max = n_cols - 1
# The maximum an agents y coordinate is allowed to be.
y_max = n_rows - 1
A plot should be produced that looks like:
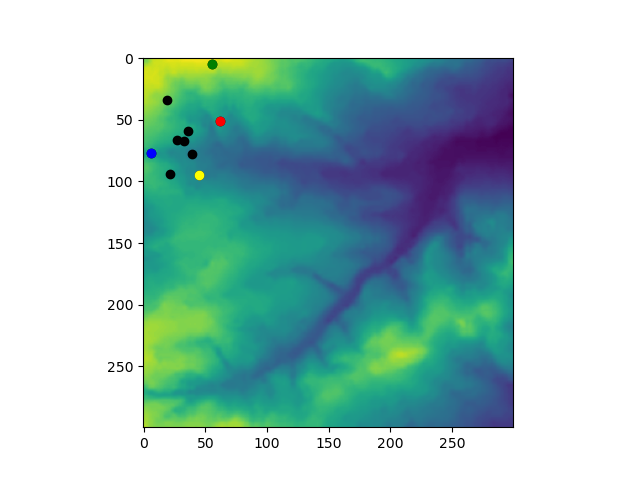
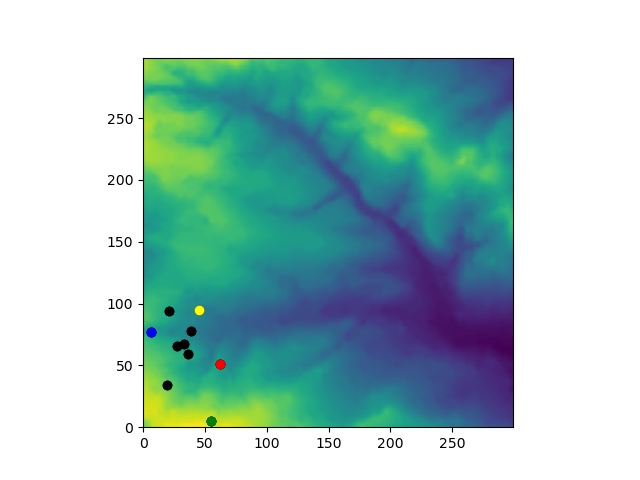
The pattern of agent locations is the same, although the plot y-axis has flipped and the x-axis and y-axis now have the same increments, so the the pattern is more squashed along the x-axis. Limit the plot axes and flip the y-axis back by adding the following code before the plot.show() function is called:
plt.ylim(y_min, y_max)
plt.xlim(x_min, x_max)
Run again and the output plot should look like:
Currently, the agents are being initialised in a corner of the environment. Change the code so that they are initialised in the middle. A good way to do this is to pass in 'n_rows' and 'n_cols' to the Agent '__init__' constructor method, and use these parameters to initialise the x and y coordinates as follows:
def __init__(self, i, n_rows, n_cols):
    """
    The constructor method.

    Parameters
    ----------
    i : Integer
        To be unique to each instance.
    n_rows : Integer
        The number of rows in environment.
    n_cols : Integer
        The number of columns in environment.
    Returns
    -------
    None.
    """
    self.i = i
    tnc = int(n_cols / 3)
    self.x = random.randint(tnc - 1, (2 * tnc) - 1)
    tnr = int(n_rows / 3)
    self.y = random.randint(tnr - 1, (2 * tnr) - 1)
Change the code that calls the constuctor method so it passes in the variables 'n_rows' and 'ncols' approprately. Run 'model.py'. The output plot should look like the following:
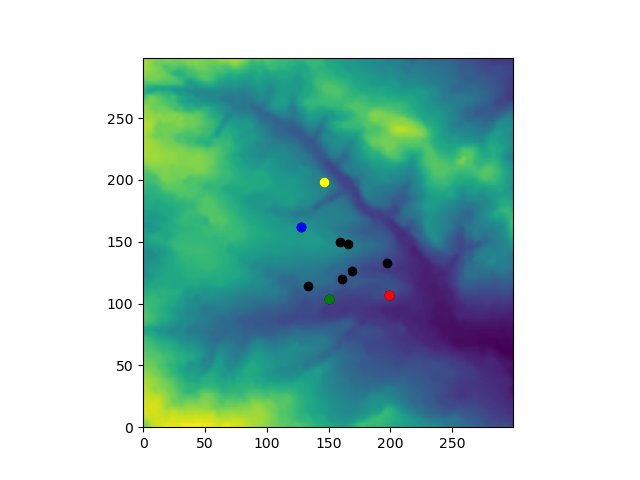
Note that although the random seed has not changed, the pattern of agent locations is different. This is because the calls to 'random.randint' are different and produce different coordinates. The pattern could have been kept the same if 100 was added to the output of the 'random.randint' calls as they were. The following code would do this and effectively initialise agents in the central third of a similar rectangular environment irrespective of the number of rows and columns:
tnc = int(n_cols / 3)
self.x = random.randint(0, tnc - 1) + tnc
tnr = int(n_rows / 3)
self.y = random.randint(0, tnr - 1) + tnr
4. Agent-Environment Interaction
Imagine that 'environment' values represent resources that can be eaten or stored by agents.
Change the constructor method of the Agent class again so that 'environment' is also expected to be passed in and keep a reference to this as a class attribute. Also create a 'store' attribute and set this equal to zero:
def __init__(self, i, environment, n_rows, n_cols):
"""
The constructor method.

Parameters
----------
i : Integer
    To be unique to each instance.
environment : List
    A reference to a shared environment
n_rows : Integer
    The number of rows in environment.
n_cols : Integer
    The number of columns in environment.

Returns
-------
None.

"""
self.i = i
self.environment = environment
tnc = int(n_cols / 3)
self.x = random.randint(tnc - 1, (2 * tnc) - 1)
tnr = int(n_rows / 3)
self.y = random.randint(tnr - 1, (2 * tnr) - 1)
self.store = 0
Change model.py so that environment is passed in correctly as agents are initialised.
In the Agent class define the following method:
def eat(self):
    if self.environment[self.y][self.x] >= 10:
        self.environment[self.y][self.x] -= 10
        self.store += 10
This method checks the value of the 'environment' where the agent is located and if this is greater than or equal to 10, the value of 'environment' where the agent is located is reduced by 10 and 10 is added to the 'store' attribute of the agent.
Write a docstring for the 'eat' method.
In 'model.py' call the 'eat' method after the move function and run the program. Some values of 'environment' around where the agents are should have changed, but this is difficult to see in the plot.
Change the plot limits for a closer look at the centre of the environment as follows:
plt.ylim(y_max / 3, y_max * 2 / 3)
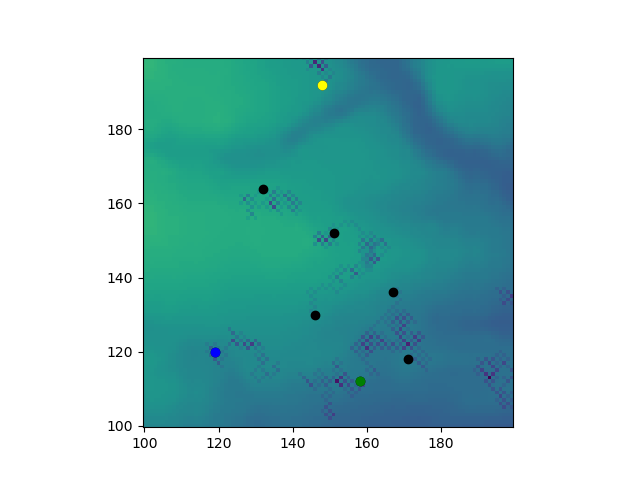
plt.xlim(x_max / 3, x_max * 2 / 3)Run the program again and you should get the following image:
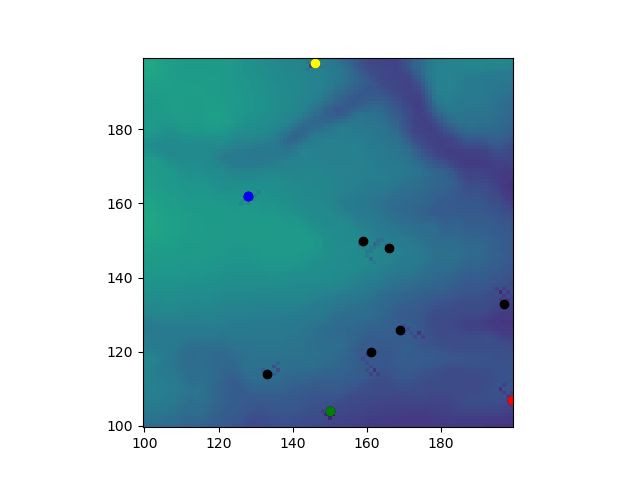
Note that two of the agents have moved to the right beyond the limited area.
Increase 'n_iterations' to 100 and run again and you should get the following image:
Note the checkered effect caused by the 'environment' being eaten away. The checkering is a consequence of the way agents move and eat.
Commit your code to your local repository and assuming you are using GitHub - push your changes to GitHub.
5. Further Assignment 1 Coding Tasks
In the eat method of the Agent class, detail an 'else' clause of the 'if' statement so that if the value of 'environment' where the agent is located is less than or equal to 10 then what is there is removed and added to the store of the agent. Test this works and write a few sentences about the testing in a document.
Define a function in 'model.py' that adds up all the values in environment.
Define another function that adds up all the store values in all the agents.
Print out these sums and check that the total amount of resource and store in the system is not changing after each iteration of the model.
Write a function called 'write_data' in 'io.py' to write out the values of environment to a file and call this function after the main model loop.
Commit your code to your local repository, and assuming you are using GitHub - push your changes to GitHub.
6. Code Review and Looking Forward
Consider what happens when two or more agents are at the same location and there is less resource at the location for all the agents to have 10: Those agents processed sooner will get to eat more resource. And, if agents are always processed in the same order, then there will be bias in favour of these agents gaining more store... Write a comment in your source code about this.